crabs                                          |>
    mutate(grand_mean = mean(bodyTemperature)) |>
    group_by(crabType)                         |>
    mutate(group_mean = mean(bodyTemperature)) |>
    ungroup()                                  |>
summarise(this_partition = sum((group_mean - grand_mean)^2))• 19. ANOVA summary
Links to: Summary. Chatbot tutor. Questions. Glossary. R packages. R functions. More resources.
Chapter summary

We previously introduced F and the ANOVA approach as an alternative to the two sample t-test. Here we show it’s true utility - by testing the single null hypothesis that all sample come from the same statistical population, we avoid the “multiple testing problem.” As such, compared to the naive testing of all pairwise differences, the ANOVA approach allows us to farily test for differences in means among numerous groups. If we reject the null that all groups are equal, we conduct a “post-hoc” test to see which groups differ.
Chatbot tutor
Please interact with this custom chatbot (ChatGPT link here, Now Gemini alllows us to share gems! Gemini link here). I have made to help you with this chapter. I suggest interacting with at least ten back-and-forths to ramp up and then stopping when you feel like you got what you needed from it.
Practice Questions
Try these questions! By using the R environment you can work without leaving this “book”. I even pre-loaded all the packages you need!
Setup
Fiddler males have a greatly enlarged “major” claw, which is used to attract females and to defend a burrow. Darnell and Munguia (2011) suggested that this appendage might also acts as a heat sink, keeping males cooler while out of the burrow on hot days. To test this, they placed four groups of crabs into separate plastic cups and supplied a source of radiant heat (60-watt light bulb) from above. The four groups were intact male crabs; male crabs with the major claw removed; male crabs with the other (minor) claw removed (control), and intact female fiddler crabs. They measured body temperature of crabs every 10 minutes for 1.5 hours. These measurements were used to calculate a rate of heat gain for every individual crab in degrees C/log minute.
Rates of heat gain for all crabs are loaded here as crabs but can be downloaded from this link: https://raw.githubusercontent.com/ybrandvain/datasets/refs/heads/master/crabs.csv
Q1.a) There are four groups. How many potential pairwise comparisons are there? .
For 4 groups, the number of unique pairs is: \[\frac{k(k - 1)}{2} = \frac{4(3)}{2} = 6\]
Q1.b) What is the probability of incorrectly rejecting one true null (at the \(\alpha\) threshold of 0.05) if all of these nulls were true?
The probability of not incorrectly rejecting a true null is 0.95. To not falsely reejct any try nulls we need six such successes. \[0.95^6 \approx 0.735\] So the probability of incorrectly rejecting at least one true null is:
\[1 - 0.735 = 0.265 \]
Q2) Consider the plot above. Before running an ANOVA or posthoc test, which comparisons do you think is most lilely to be significantly different?
Calculate the sample size, mean, and variance for each treatment
Q3) Compare the variance with in each treatment. What is the greatest fold difference in variance between treatments?
Q4) With this difference in variance among groups, the assumption of homoscedasticity is
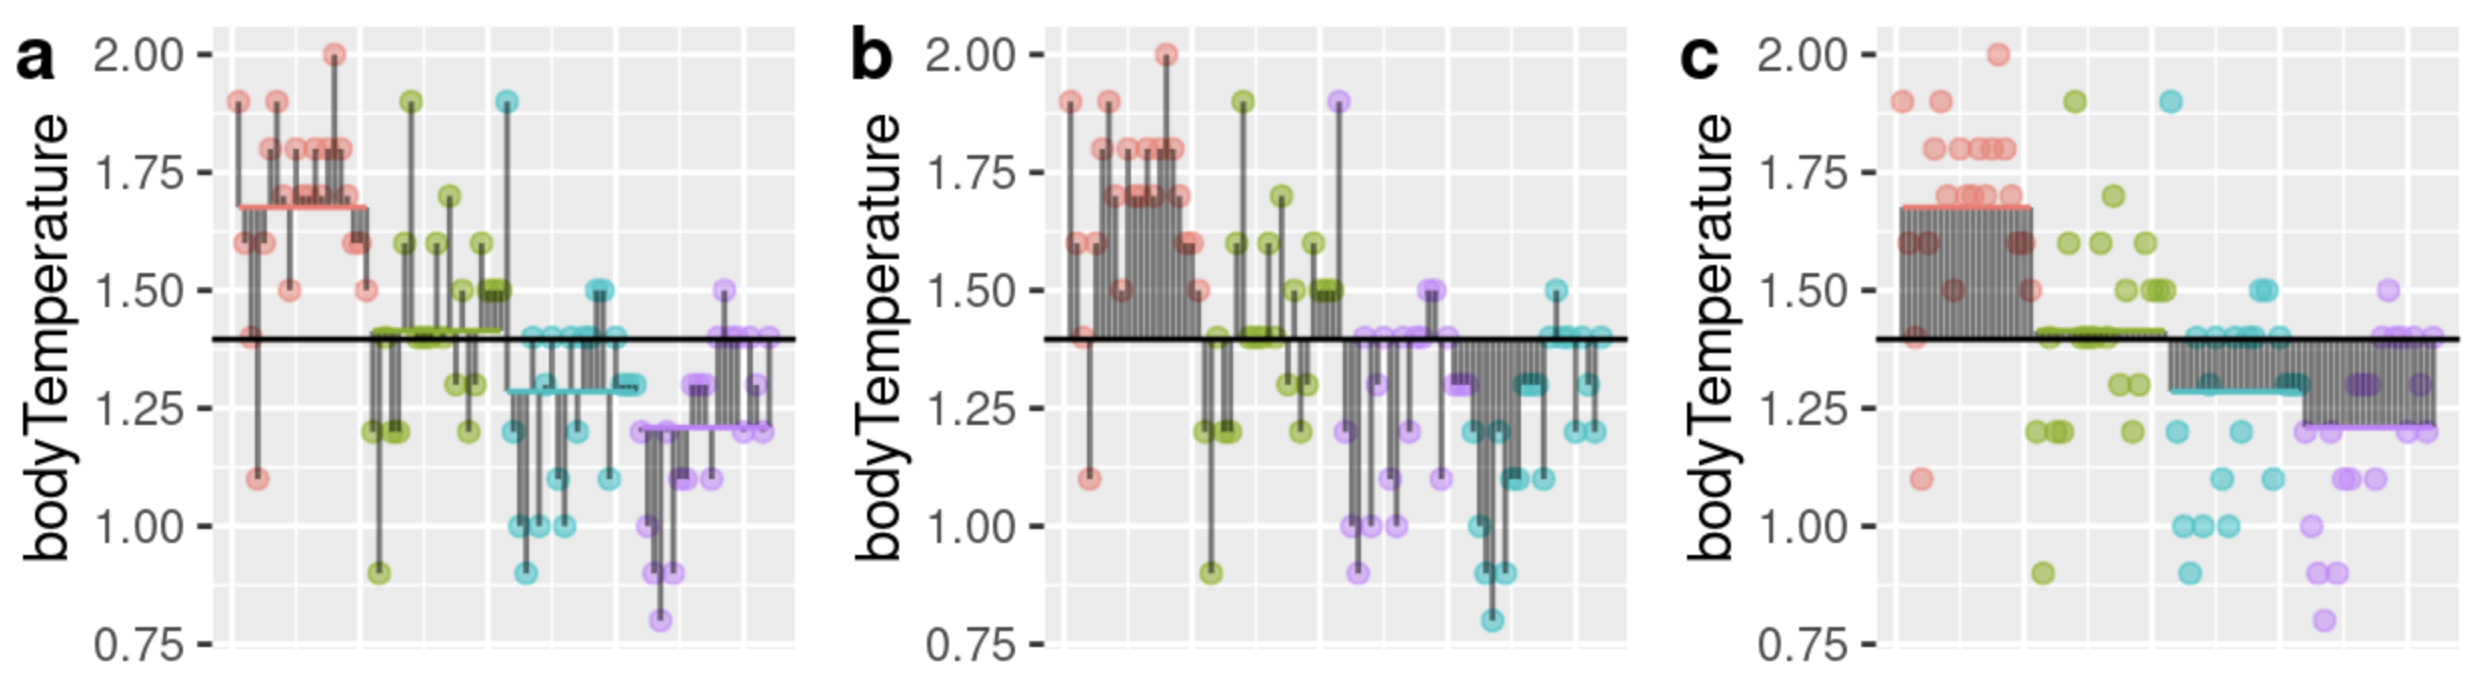
Q5.a) Which of the plots above shows total deviations? .
Q5.b) Which of the plots above shows model deviations? .
Q5.c) Which of the plots above shows error deviations? .
Assume we where using the code below to build an ANOVA for the crabs data
Q6) What would be the best name for this_partition?
Q7.a) Why didn’t the code above work?
Q7.b) Fixing this error, which assumption are these plots meant evaluate?
Q7.c) Which wo of the plots are reasonable ways to evaluate this assumption. Fixing this error, which assumption are these plots meant evaluate?
Q8.b) An ANOVA table
Q8.c) Results of post-hoc tests
Q8.d) Model coefficients and standard errors, plus numerous potentially misleading p-values and t-values that should largely be ignored
Q8) In the context of an ANOVA, which R command gives you:
Q8.a) Estimates of model coefficients ONLY?Run the relevant statistical tests below
Q9) Run an anova on the data. What do we do to the null hypothesis?
Q10) According to. the post-hoc test, if female intact is in significance group, “a”, which group(s) is intact male male major in?