• 2. Selecting columns

Motivating scenario: you want to pick out a few columns to work with from a larger tibble.

Learning goals: By the end of this sub-chapter you should be able to

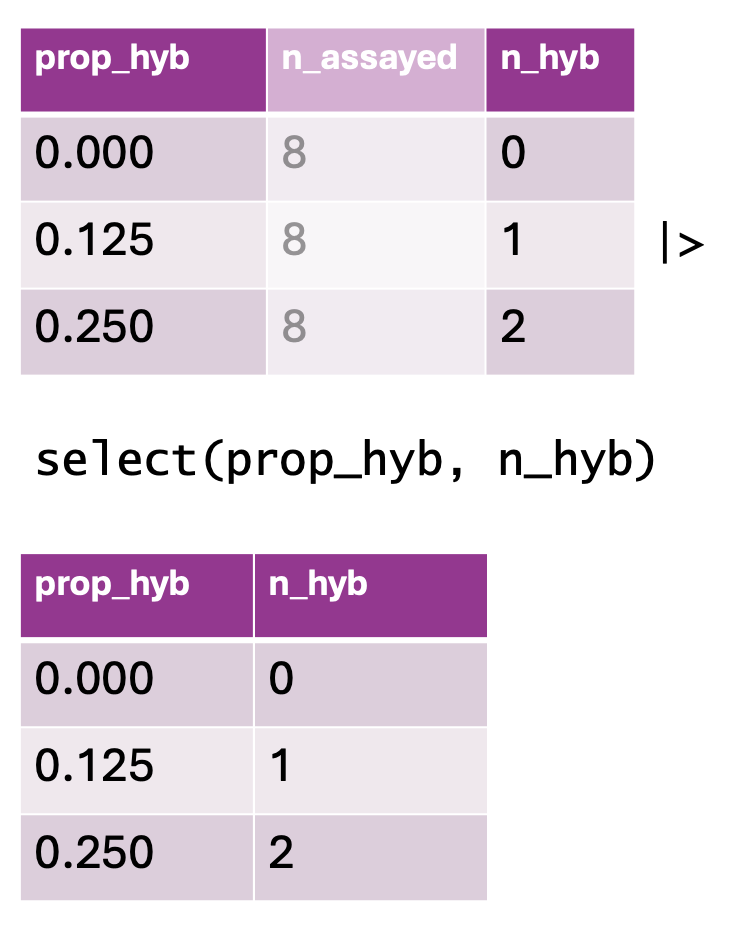
  1. Use the dplyr function, select(), to limit our data to a few variables of interest.
A visual representation of using `select()` in `dplyr`. The top table contains three columns: `prop_hyb`, `n_assayed`, and `n_hyb`, showing values of hybrid proportions, sample sizes, and computed hybrid counts. Below, an R code snippet applies `select(prop_hyb, n_hyb)`, removing `n_assayed` and keeping only the first and last columns. The resulting table, displayed at the bottom, reflects the updated dataset with only `prop_hyb` and `n_hyb` remaining, shown with consistent formatting.
Figure 1: Using the select() function to retain specific columns from a dataset. The top table contains three columns: prop_hyb (proportion of hybrids), n_assayed (number of individuals assayed), and n_hyb (the computed number of hybrids). The select(prop_hyb, n_hyb) function is applied, keeping only the prop_hyb and n_hyb columns. The bottom table displays the resulting dataset after column selection.

select()ing columns of interest

The dataset above is not tiny – seventeen columns accompany the 593 rows of data. To simplify our lives, let’s use the dplyr function, select(), to limit our data to a few variables of interest:

  • location: The plant’s location. The pollinator visitation experiment was limited to two locations (either SR or GC), while the hybrid seed formation study was replicated at four locations (SR, GC, LB or US). This should be a <chr> (character), and it is!
  • prop_hybrid: The proportion of genotyped seeds that were hybrids.
  • mean_visits: The mean number of pollinator visits recorded (per fifteen minute pollinator observation) for that RIL genotype at that site. This should be a number <dbl> (double), and it is.
  • petal_area_mm: The area of the petals (in mm). This should be a number <dbl> (double), and it is!
  • asd_mm: The distance between anther (the place where pollen comes from) and stigma (the place that pollen goes to) on a flower. The smaller this number, the easier it is for a plant to pollinated itself. This should be a number <dbl> (double), and it is.
  • growth_rate: The variable we should have just fixed now it should be a number.
  • visited: A logical variable indicating if the plant received any visits at all.
ril_data |> 
  dplyr::select(location,   prop_hybrid,  mean_visits,  
                petal_color, petal_area_mm,  asd_mm, 
                growth_rate, visited)
# A tibble: 593 × 8
   location prop_hybrid mean_visits petal_color petal_area_mm asd_mm growth_rate
   <chr>          <dbl>       <dbl> <chr>               <dbl>  <dbl>       <dbl>
 1 GC             0           0     white                44.0  0.447       1.27 
 2 GC             0.125       0.188 pink                 55.8  1.07        1.45 
 3 GC             0.25        0.25  pink                 51.7  0.674       1.8  
 4 GC             0           0     white                57.3  0.959       0.816
 5 GC             0           0     white                68.6  1.41        0.728
 6 GC             0.125       0     pink                 66.3  0.788       1.76 
 7 GC            NA          NA     <NA>                 51.5  0.6         1.58 
 8 GC             0           0     white                48.1  0.561       1.48 
 9 GC             0          NA     white                51.6  1.02        1.14 
10 GC             0.25        0     white                89.8  0.618       1    
# ℹ 583 more rows
# ℹ 1 more variable: visited <lgl>
Warning: R does not remember this change until you assign it.

So, now that we see that our code worked as expected, enter:

ril_data <- ril_data |> 
  dplyr::select(location,  prop_hybrid,  mean_visits,  
                petal_color, petal_area_mm,  asd_mm,  
                growth_rate, visited)