• 13. Considerations for NHST
Motivating Scenario: You have your p-value and have made a decision to “reject” or “fail to reject” the null model. Now you face a new challenge: how do you present and discuss these results responsibly, avoiding the common traps and misinterpretations?
Learning Goals: By the end of this subsection, you should be able to:.
- Distinguish between what a p-value is and what it is not.
- Explain common misunderstandings of p-values, and how to correct them.
- Explain the Prosecutor’s Fallacy and its relevance to the interpretation of NHST.
Why the Interpretation of P-values is Hard
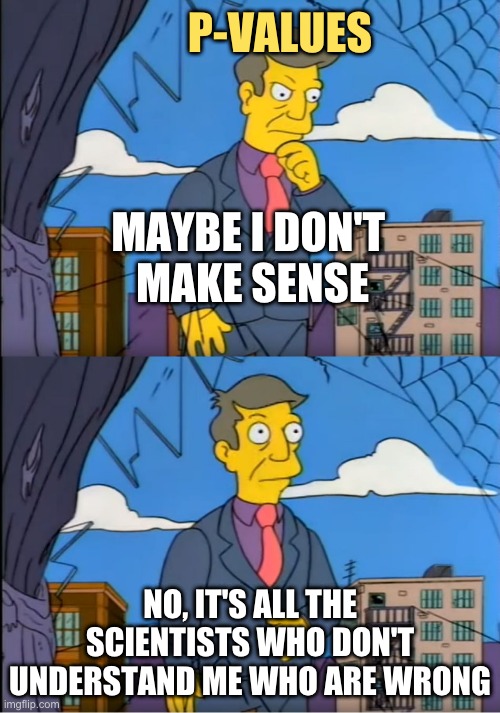
Students often struggle to understand p-values, and for good reason. The NHST framework is built with backwards logic on a shaky foundation. We want to know the probability that our biological hypothesis is correct, but the p-value tells us nothing about it. Instead, a p-value tells us the probability of observing our data (or something more extreme) assuming the null hypothesis is true. We then make an indirect inference: if our data are unusual under the null, we tentatively conclude the alternative is correct, even though we never actually tested the alternative model. This flawed premise, combined with scientific customs that can feel arbitrary, is the source of much confusion.
The common misinterpretations of a p-value I believe, reflect people wishing that a p-value reported something useful or logical. But it is not. A p-value is none of the following things:
A P-VALUE IS NOT “the probability that the null hypothesis is true” NOR IS IT “the probability that what we observed is due to chance.” These are both incorrect because the p-value is simply the probability that we would observe our data, or something more extreme, assuming the null hypothesis is true.
A P-VALUE DOES NOT say anything about the alternative hypothesis. A p-value simply describes how unusual it would be for the null model to generate such an extreme result. Again, I understand the desire to have the p-value tell us about the alternative hypothesis, because this is usually more interesting. Sadly, p-values can’t do that.
A P-VALUE DOES NOT measure the importance of a result. Again, such a measure would be great to have, but we don’t have that. The importance of a result depends on its effect size and its role in the biological problem we’re investigating.
What does this mean for us as scientists? It means that we have two challenging responsibilities. First, we must understand the process of null hypothesis testing well enough to participate in its customs and rituals. Second, we must simultaneously interpret these statistics with caution and responsibility. A responsible interpretation means remembering that rejecting \(H_0\) does not prove it’s false, and failing to reject \(H_0\) does not prove it’s true or mean there is no effect. A good practice is to always look beyond the p-value to the effect size and consider if it’s consistent with a plausible biological model.
The Prosecutor’s Fallacy
The video above makes a clear point: We calculate the probability that a random sample from the null distribution would produce our test statistic or something more extreme (i.e. \(\text{p-value} = P(\text{Data or more extreme}|\text{H}_0\)). Unfortunately, what we really want to know – probability of our null model given the data (\(P(\text{H}_0|\text{Data or more extreme})\) – is not provided by NHST.
Later in the term, we’ll see that Bayes’ theorem sets up a different way to do stats, one that answers questions like “what’s the probability of the null hypothesis given my data?” by flipping these conditional probabilities. However, for most of this class, we cover classic frequentist statistics, so we have to remember that we are not answering that question.
Why is NHST so prevalent?
Q: Why do so many colleges and grad schools teach p = 0.05?
A: Because that’s still what the scientific community and journal editors use.
Q: Why do so many people still use p = 0.05?
A: Because that’s what they were taught in college or grad school.
So, with all the issues with p-values and null hypothesis testing, why am I teaching it, and why do we still use it as a field? I think there are two compelling reasons:
Tradition! I teach this because this is how science is often done, and you should understand the culture of science and its rituals. When you read studies, you will see p-values, and when you write results, people will expect p-values. While the quote above makes light of this tradition, society function because of a set of agreed upon conventions – e.g. “why do we drive on the right side of the road?” At the same time, you should recognize that this isn’t the only way to do statistics – For example, Bayesian stats is quite mainstream. We will return to Bayesian stats at the end of the term.
It works! Scientists have used this approach for decades and have made continual progress. So, although the theoretical underpinnings of null hypothesis significance testing are shaky, it’s practically quite useful. Unlike George Cobb, I believe we keep using p-values and p = 0.05 because it seems to work well enough. That said, I believe that the nuanced understanding I’ve tried to equip you with in this chapter helps us make even better use of p-values.
Alternatives to Null Hypothesis Significance Testing
Due to the issues surrounding p-values, such as the arbitrary distinction between “significant” and “non-significant” results, some have proposed alternative approaches to statistics.
These alternatives include banning p-values, replacing them with confidence intervals, and conducting Bayesian analyses, among others. I highly recommend the paper, Some Natural Solutions to the p-Value Communication Problem—and Why They Won’t Work (Gelman & Carlin, 2017), for a fun take on these proposals.
Notably, Gelman rejects my solution of teaching better. He says teachers are the problem.
OPTIONAL: The Bayesian Approach
Here, I briefly introduce Bayesian statistics. Bayesian statistics aims to find the probability of a model given the data, using Bayes’ theorem. This is often the type of question we want to answer. However, a word of caution—frequentists believe there is no probability associated with the true parameter, as populations have fixed parameters. In contrast, Bayesians believe that parameters have probability distributions that reflect uncertainty or prior knowledge about them. This represents a fundamentally different way of thinking about the world.
\[P(\text{Model}|\text{Data}) = \frac{P(\text{Data}|\text{Model}) \times P(\text{Model})}{P(\text{Data})}\]
We can break this down with new terminology:
- \(P(\text{Model}|\text{Data})\): the “posterior probability” — the probability of the model given the observed data.
- \(P(\text{Data}|\text{Model})\): the “likelihood” — the probability of observing the data under the given model.
- \(P(\text{Model})\): the “prior” — our prior belief about the probability of the model or parameter values before seeing the data. This can come from previous studies, expert knowledge, or assumptions.
- \(P(\text{Data})\): the “evidence” — the overall probability of the data, which serves to normalize the result. It can be computationally intensive to calculate, but there are methods like Markov Chain Monte Carlo (MCMC) to approximate this value.
\[\text{Posterior Probability} = \frac{\text{Likelihood}(\text{Model}|\text{Data}) \times \text{Prior}}{\text{Evidence}}\]
Notably, Bayesian methods allow us to study “credible intervals” — regions with a 95% probability of containing the true population parameter, as opposed to “confidence intervals,” which in frequentist statistics only describe the frequency with which the interval will contain the true parameter in repeated samples.