13. Null Hypothesis Significance Testing
Motivating Scenarios: This chapter cuts through so much of what we see in stats - so I could not limit myself to one scenario!
You want to understand the standard by which scientists take results seriously versus chalking them up to sampling error.
You are told results are “statistically significant” or they have some given pvalue, and we want to know what that means.
You have done a statistical analysis and want to guard against the possibility that our seemingly exceptional results are merely attributable to sampling error.
There is one MAJOR GOAL here: You should understand a p-value and its limitations. But to break this down. By the end of this chapter, you should be able to:
- Explain why we create null models and what makes a good one.
- Explain the motivation for Null Hypothesis Significance Testing (NHST).
- Explain the role of a test statistic in hypothesis testing.
- Describe a p-value in relation to the sampling distribution under the null.
- Explain what a false positive and a false negative are, and how likely we are to observe one or the other as sample size increases.
- Explain why a p-value is not “the probability that the null is true.”
- Explain the concept of statistical power and how it relates to sample size and effect size.
Review and Motivation for NHST
The major goals of statistics are:
- Estimation (with uncertainty).
- Hypothesis testing, and
- Inferring causation.
We have spent some effort in estimation, and now know (one way) to include uncertainty. We will put off inferring cause for later in the book. So, here we will introduce the ideas behind hypothesis testing, why we do it, and what it does and does not mean.
To get started, let’s return to the foundational challenge in estimation. That is, we want to know. about parameters from populations, but can only access estimates from samples. We know that even in the best-designed scientific studies, sampling error will pull sample estimates away from population parameters.
The goal of null hypothesis significance testing (NHST) is to determine whether our observations can be reasonably explained by sampling error.
NHST Example
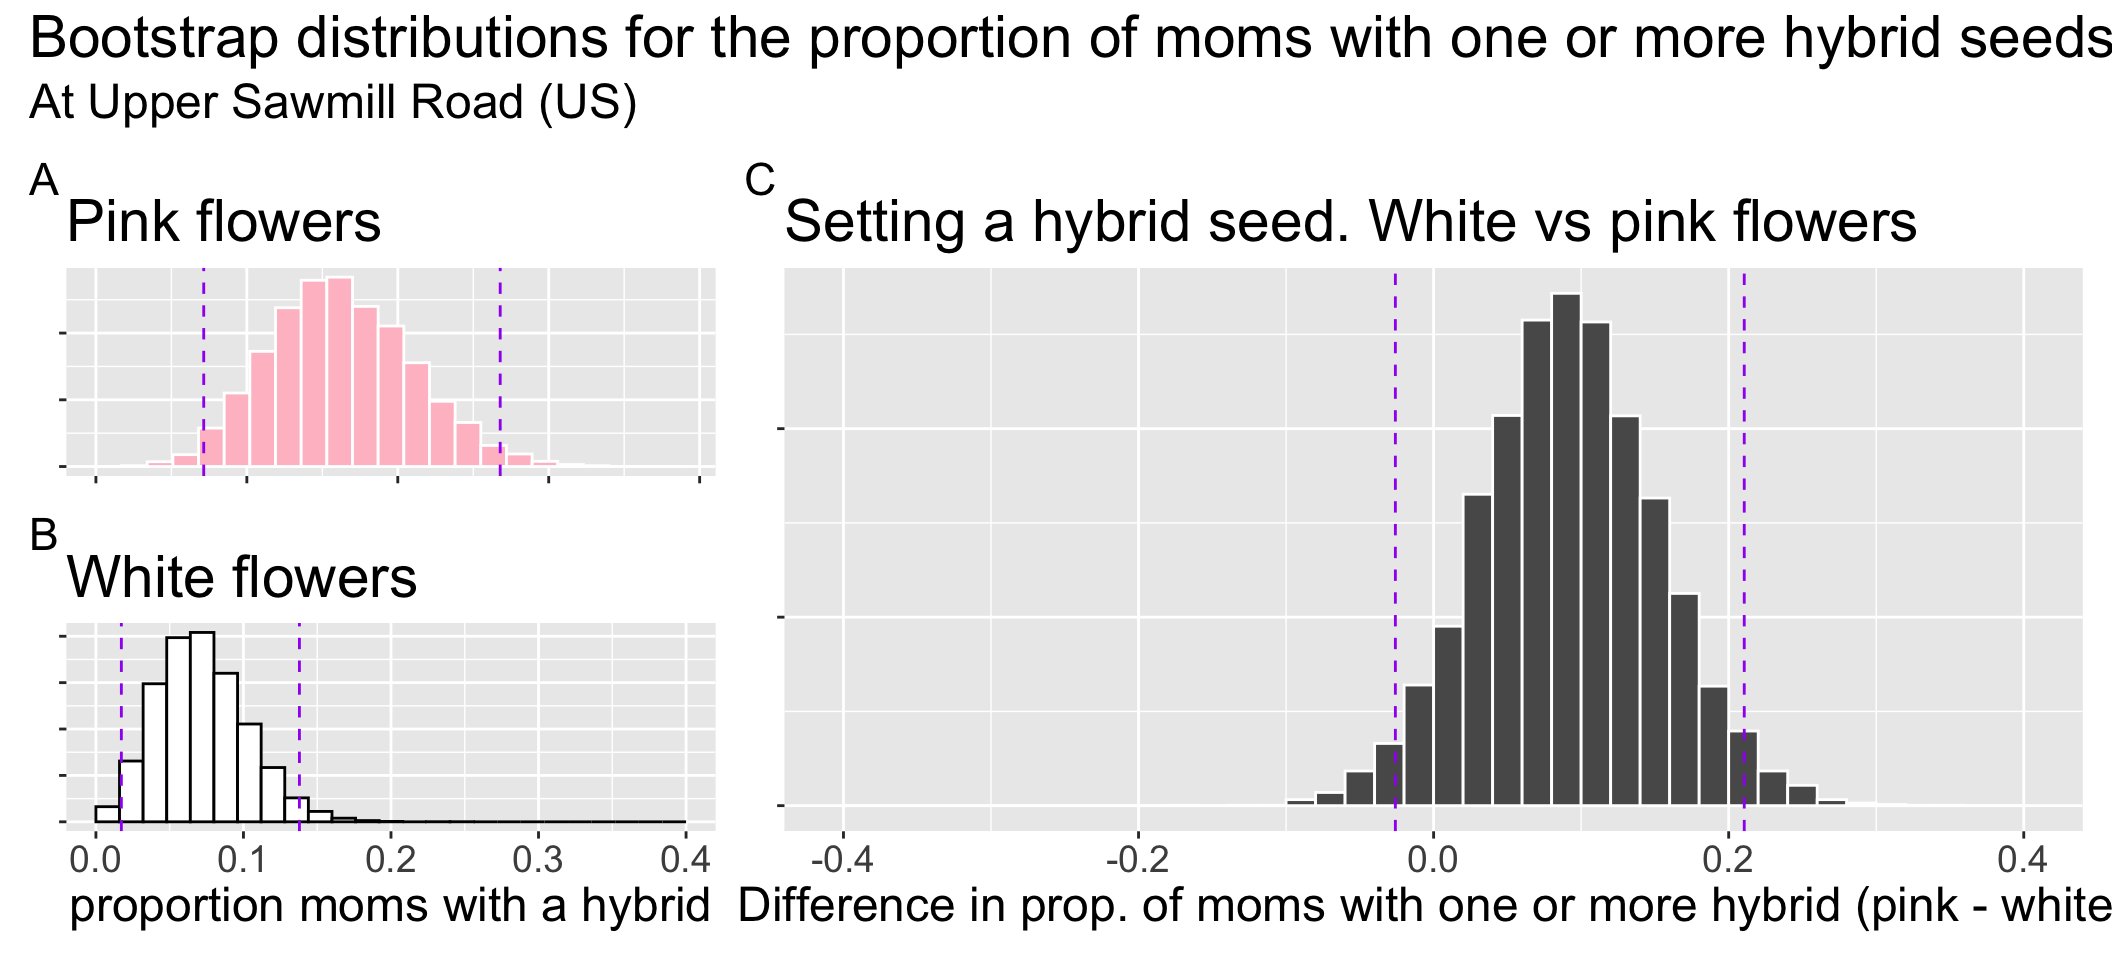
Let’s work through an example: We planted pink and white-petaled parviflora RILs at the Upper Sawmill (US) location. Of the 114 assayed plants with known petal color:
- 9 of the 56 pink-petaled RILs (aka 16.1%) set at least one hybrid seed.
- 4 of the 58 white-petaled RILs (aka 6.9%) set at least one hybrid seed.
We may naturally want to compare these values. So, are white-flowered parviflora RILs at Upper Sawmill less likely to have at least one hybrid seed than pink-petaled plants? Let’s consider some ways we could address this question with our tools so far:
Let’s get real. I hand-picked this somewhat strange case to get us thinking about the problem. A direct way to address the plausibility that these two samples came from the same statistical population is to evaluate if the 95% confidence interval of their difference overlaps zero. This is one valid way to perform a hypothesis test. The rest of this chapter will focus on the traditional NHST framework, which uses p-values to answer the same question.
- By simple estimation – 6.9% is way less than 16.1%. But we know by now that must incorporate uncertainty.
- Comparing Figure 1 A to Figure 1 B we see that the 95% confidence intervals of these estimates broadly overlap one another.
- But the more appropriate comparison of the 95% confidence interval of the difference in proportions (Figure 1 C) just barely overlaps zero .
- tl/dr it is unclear.
Null Hypothesis Significance Testing
In principle, in addition to a real effect, sampling bias, non-independent sampling, and sampling error could all lead to a deviation between estimates and true population parameters. Our goal in null hypotheses significance testing is to see if results are easily explained by sampling error. That is, NHST helps us assess whether the differences between our observations and expectations can be attributed to sampling error.
In null hypothesis significance testing, we aim to determine how easily our results can be explained by a “null model.” To do this, we follow three key steps:
- State the null hypothesis and its alternative (subsection Statistical Hypotheses).
- Calculate a test statistic to summarize the data, and compare it to its sampling distribution under the null model (subsection P Values).
- Interpret the results. If the test statistic falls in an extreme tail of the sampling distribution, we reject the null hypothesis; otherwise, we do not. (subsection Statistical Significance.
This last step is relatively easy to do. But explaining and understanding this step represents one of the more challenging concepts in statistics. Part of the difficulty lies in the fact that what we traditionally do in the field doesn’t entirely make sense. We will therefore go over Considerations for NHST before moving on to our chapter summary.