.jpg)
• 9. Audience & Format
Motivating Scenario:
You have figured out the story you plan to tell with your data.But before you dive too deep, pause for a moment: Who’s going to see this plot? And how are they going to see it? And how can we use this information to make our plot most impact.
Learning Goals: By the end of this subchapter, you should be able to:
- Identify key types of audiences for scientific figures, and recognize what each needs from a plot.
- Describe how figures function differently in talks, posters, papers, and online formats.
- Make thoughtful tradeoffs between detail, clarity, and interpretability depending on audience and format.
4 Build a workflow that separates early exploratory plotting from later communication-focused refinement.- Know that “premature optimization is the root of all evil.”
The Audience and the Format
Labeling something as a “good plot” or a “bad plot” is overly simplistic. Sure, there are features that make a plot “better” or “worse”, but plots do not have an independent existence. Plots are presented to specific audiences in specific contexts. Considering your audience and the presentation format is key to making a truly effective visualization.
The Audience

We tell stories to an audience, not a wall. Just as you would communicate differently with a friend versus a colleague, your plot should be tailored to its intended audience. When designing a figure, ask yourself: (1) Who is this for? (2) What background knowledge or context do they bring (3) What do they need from this? (4) What do you want from them – Feedback? Funding? Action? Respect etc…?
“Archetypes” of a potential audience for your plot include:
🫵 You and Your Team: You are the first person to look at your plot. You want to know that you are not fooling yourself. You are deeply familiar with the data, methods and many peculiarities of the study.
- For this audience: You may want to color points by technical covariates (e.g. when the reading was taken, who took it? which machine was used? etc) and use tools like plotly to understand outliers so that you don’t waste weeks digging into the wrong story.
🧠 The Expert Critical Reader: This is the scientific audience for academic articles. Often a peer, a reviewer, or even a competitor. The expert wants precision, detail, honesty and clarity. The expert wants to quickly know what you did and what it means, but may be quite critical of your results so would like to be able to evaluate the evidence for themselves.
- For this audience: You will likely want to guide their interpretation but while showing all the data and empowering them to verify your conclusions.
🤷 The Curious Novice: Not everyone encountering your work will be an expert. You might communicate your work to students just beginning to master the subject, or biologists from a related subdiscipline. This audience too, would like to be critical, but often needs additional context, background, and structure to make the most of a plot.
- For this audience: Your main job here is as a teacher. You should explain your plots very clearly, and their points should be obvious.
📣 The Public or Non-Expert: You might present your work to a broad audience (e.g. TEDx style), to a lawyer, a jury, a politician etc. These people are likely interested in your work (they’re here aren’t they?), and do want to be able to evaluate its legitimacy, but may not have statistical or biological expertise.
- For this audience: Your main job here is as a convincer. As the expert, you aim to help this audience see things your way. Make your plots clear and easily digestible. You should largely refer to published studies for legitimacy, but be prepared to handle questions from engaged participants.
Tailoring Presentations to Their Format
In one notable incident, officials at what is now Colorado State University Pueblo refused to honor the request, leading the band to go on a rampage that involved throwing food all over a dining area as well as “unmentionable” acts in a nearby restroom. However, even more damage was caused to the basketball floor in the gymnasium due to the weight of the stage brought in.
Science is communicated in many formats. Here’s how to tailor your plots to different mediums:
- 📘 Books / Papers: These plots are static and need to be self-contained. Readers should be able to understand the plot and its main point without relying on the accompanying text. You don’t know how people will read your paper.
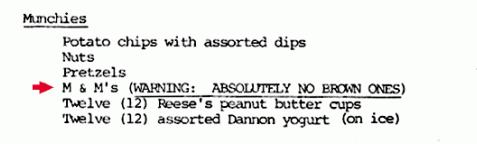
Plots as “Brown M&Ms”
The American hard rock band Van Halen had a strange issue in their “rider” - they insisted on having a bowl of M&Ms but no brown M&Ms Figure 2. While they did have a very rock bad diva response to this being broke (see the quote o the right), this request was more than a rock-diva thing. As explained by vocalist David Lee Roth this request was a way to ensure that the venue had closely read the requirements for the show to ensure safety (as aluded to at the end of the Wikipedia quote).
In the same way, scientists use visual cues to make rapid judgments about the quality and trustworthiness of research. A sloppy, unpolished plot acts like a brown M&M in the candy bowl; it’s a red flag that signals a potential lack of care that could extend to the data analysis itself (evenif the analysis is fine). A polished, professional plot does the opposite: it signals that the author is careful and trustworthy. It tells the reader they are in good hands.
🎤 Public Talks: In presentations, you control the flow of information. A successful plot in a scientific talk:
- Builds up figures slide by slide, to encourage audience understanding and engagement.
- Uses large text, big points, and wide lines so that it is legible from the back of the room.
- Favors results and interpretation over details.
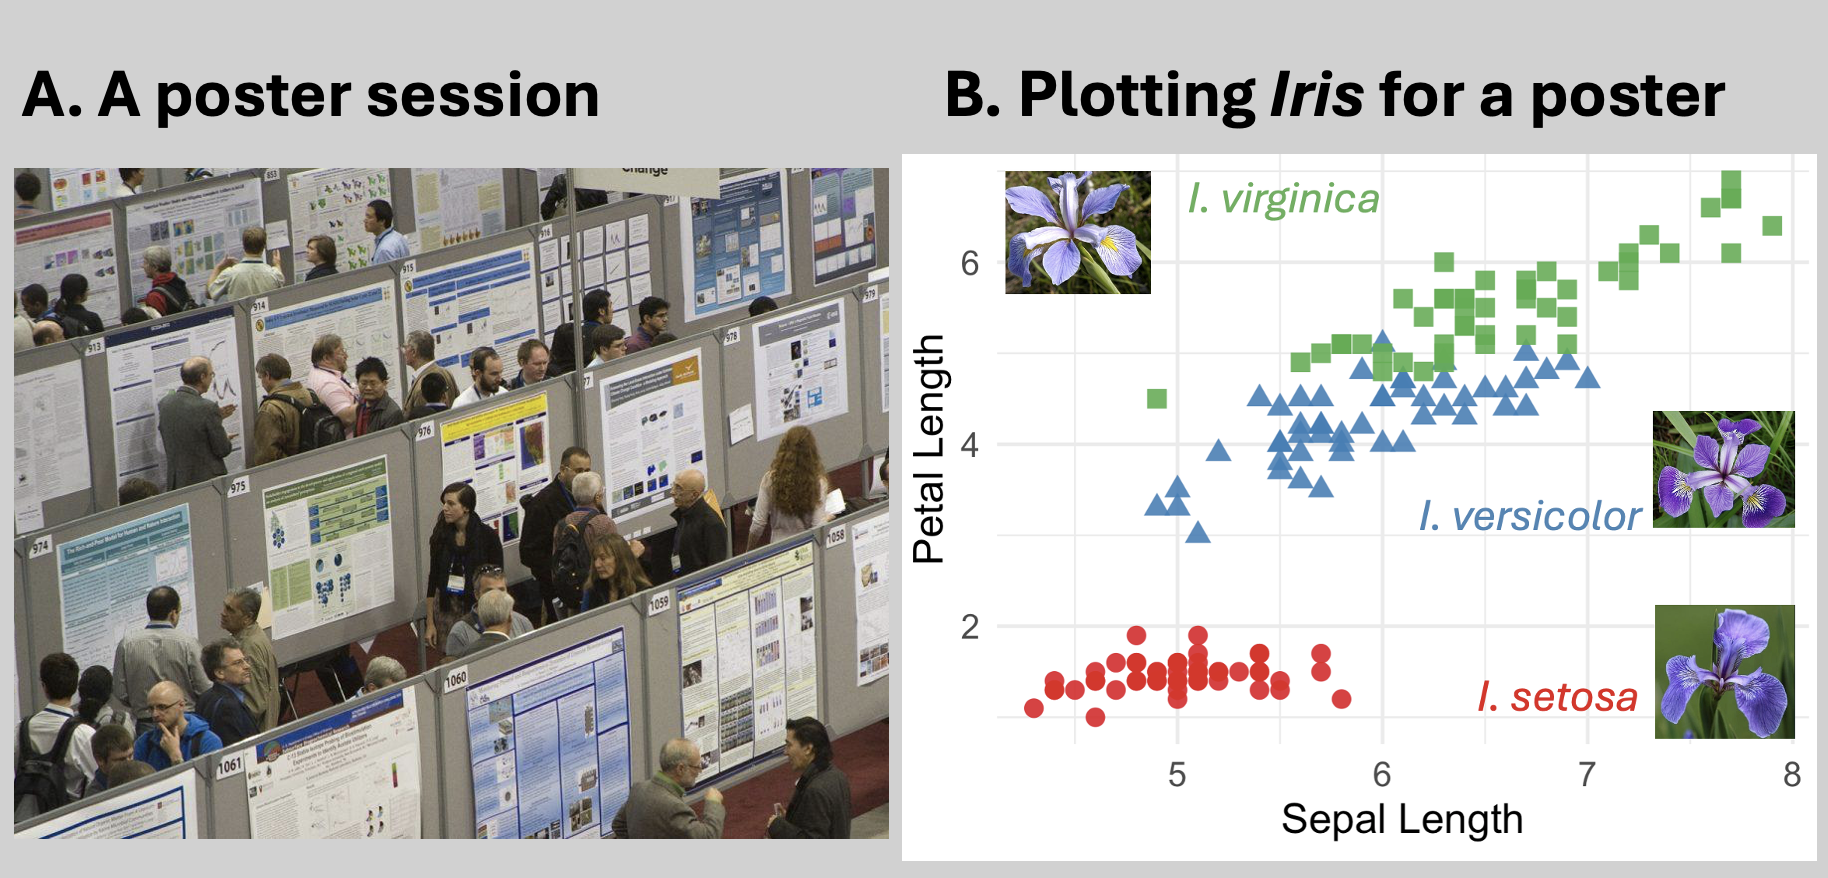
🖼️ Posters:. Because your poster will be presented alongside tens or hundreds of others in a big room (Figure 3 A), your poster and its figures should be designed to draw viewers in and encourage them to engage. Posters are arguably the most difficult format in science communication, so here are some tips:
- Make it stand out: You’re often in a room with tens to hundreds of posters, and people are circulating casually, often with a coffee or drink in hand. Catch their eye. There is a time and place for charjunk and that time and place is a poster session.
- Use as little text as possible: Once you’ve removed unnecessary text, go back and remove even more.
- Make all graphical elements big: Text, points, labels—all of it.
- Make it stand out: You’re often in a room with tens to hundreds of posters, and people are circulating casually, often with a coffee or drink in hand. Catch their eye. There is a time and place for charjunk and that time and place is a poster session.
- 💻 Digital Formats: Online formats allow for interactive elements, GIFs, and animations. These can help readers explore your data themselves, making the story more intuitive and engaging, but don’t overdo it. You should focus on helping readers engage with the plot to absorb the key results, not distract them from those results. As you can tell from my efforts in this book, this is my favorite context.
Summary of the impact of medium on plot development.
| Format | Key Feature | Prioritize |
|---|---|---|
| Paper | Static, standalone | Clarity, context in figure |
| Talk | Controlled pacing | Simplicity, build-up, big elements |
| Poster | Competitive and noisy setting | Visual impact, minimal text |
| Digital | Dynamic & user-driven | Interactivity, clarity |
We should forget about small efficiencies, say about 97% of the time: premature optimization is the root of all evil. Yet we should not pass up our opportunities in that critical 3%
Premature optimization is the root of all evil
Although Donald Knuth was talking about optimizing computer programs, the same logic applies to figures. In research or publication contexts, refining the plot can be worth the time - but only after the scientific story is sound. Perfecting a plot before it is ready to be presented can be a massive time sink. I therefore recommend the following workflow to make great plots without wasting too much time:
Make quick, rough plots to start exploring the stories in your data.
Make additional plots and summaries to see if you fooled yourself and/or if an artifact can better explain your data than your hypothesis.
Make a good “base plot” that clearly and honestly shows the point and circulate this to friends collaborators etc.
Save the code for this plot and don’t lose it.
🛑STOP🛑 working on the plot for a while. Do everything else to make your science good. Resist the urge to keep tweaking at this stage - your time is better spent elsewhere for now.
Once you are ready to present the work take steps towards further refining the plot following the concepts outlined in the rest of this chapter. Now is the time to make this figure shine!!! Do most of this in R - but feel free to spruce a quick thing up some other way (e.g. powerpoint / illustrator etc…) if it’s fast one-off.